
Turbidity using New Dual-Angle Light Scattering Instrumentation |
|||||||
|
|
Model DSBFor
90° and forward scatter at levels, sizes, and particle types typically
found in the brewery filter room beer line. By John Byrnes & Andrea Valentine |
||||||
Abstract
There
is a recent interest in multiple angle simultaneous in-pipe turbidity
measurement. This is in addition to the 90° ASBC/ EBC or forward
scatter measurements now made. This
paper presents actual simultaneous measurements by a single instrument
showing the various sensitivities of the two angles to yeast,
diatomaceous earth, and protein size particles. The paper includes a
description of the apparatus, experimental method and laboratory
technique with photographs. The
conclusion is the presentation of the actual data in graphic or tabular
form. Introduction
Product
clarity is the single characteristic most apparent to the buyer at the
time of purchase, and therefore very important to the brewer. Beer filtration is traditionally monitored at the final
filter for solids content. The instrument is usually a nephelometer,
in-line and in the laboratory (see Methods of Analysis of the ASBC,
Beer-27). These
nephelometers measure scattered light at a 90-degree angle to the axis
of the incident light. Haze and turbidity are measured by the
nephelometer as turbidity in FTU (Formazin Turbidity Units) and these
FTU, in turn, are proportional to particle concentration. The
most common particles that make up this haze measurement are yeast and
proteins/tannins. Filter aid, including diatomaceous earth, may also be
present and contribute to beer haze. Some
brewers measure haze using an instrument that employs a "forward
scatter" technique. Instead of placing the scattered light detector
at a 90-degree angle to the axis of the incident light, it places the
detector at a smaller angle (10 - 25 degrees) from the axis. The forward
scatter measurement is intended to be more sensitive to larger
particles. Objective
This paper presents data showing the
measured light that is “side scatter” (90º), and “forward
scatter" when measuring typical beer particles. The equipment used is a new in-pipe hazemeter developed by
McNab Incorporated. This
design was developed to measure both side scatter and forward scatter
simultaneously; using a common light source and optics.
This eliminates the ambiguity of measurements taken at different
points and with different optical systems.
The variation due to the transportation of samples to a
laboratory hazemeter is eliminated as well.
The operator can observe each reading 90º (FTU) or forward
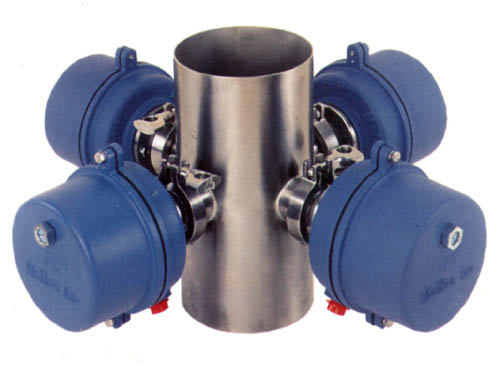
scatter as desired. Apparatus
The instrument used for the test includes
a pipe section flow cell with integral light source and sensor, and an
electronic analyzer. The
analyzer (Figure 1B) provides simultaneous readout of haze, in FTU per
ASBC, with a digital readout for each channel and an analog 4-20mA
output. A three-inch
diameter flow cell was used with the optics mounted directly in the pipe
section, per standard practice. The
flow cell (Figure
1C) is 12 inches long. The
in-line turbidimeter is usually located after the beer filter.
An additional location would be after PVPP and trap filters. The instrument, the Model
DSB, uses a single polychromatic and near-infrared collimated light
source to illuminate the liquid stream in the pipe.
Readings shown as 90º scatter in the graphs are from a detector
located at an angle of 90º from the axis of the collimated light.
Readings marked forward scatter on the graphs were made be a
sensor located directly opposite the light source, on the axis of the
collimated light. A metal
blocking disk stops the directly transmitted light. A series of non-imaging optics collects light which has
scattered at a small angle (10º - 25º, typically) from the axis of the
light source. This light is
then measured by the forward scatter sensor (Figure
1A) A third sensor is located in front of the
blocking disk, directly on the axis of the light beam. This sensor
collects light transmitted directly from the light source. The resulting
signal from this reference detector is compared by the instrument to the
signals coming from the side scatter and forward scatter sensors.
Ratio division of the measured signal by the measured signal is
performed to eliminate common mode problems, such as the loss of light
due to change in color of the carrier liquid. Method
Particles tested have been chosen to be
representative of particles found in a beer filtration line:
In each of the graphs shown (Figures 2,
3, and 4),
the particle population is limited to one of these three types and the
concentration of the type chosen for each graph is varied.
The sample is illuminated by the hazemeter light source, and both
side scatter and forward scatter are measured simultaneously.
The result is plotted on the graph.
Units of measure are shown in FTU (ASBC).
The 90º data can also be shown in equivalent EBC turbidity
units. The forward scatter signal is usually shown in ppm silica, but is
imposed on the EBC scale here for comparison. In this test, yeast samples were taken
from a brewery after fermentation, before storage or filtration.
For the beer protein graph, polymer beads were used with typical
sizes under 200nm. This approximates the small size of beer proteins
present after filtration. Continuous agitation was provided where needed
to keep the solids in suspension. Results
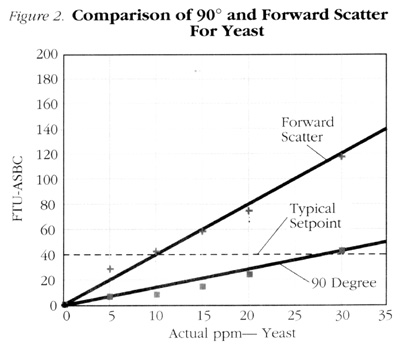
Figure 2
shoes the results of test using yeast particles.
These particles are typically 20,000nm in diameter.
Both forward and 90º sensors measure the changes in particle
concentration, and respond to increased concentration.
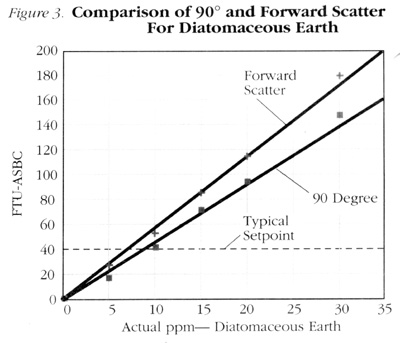
The slope of the line shows the gain or response of the system. Figure 3
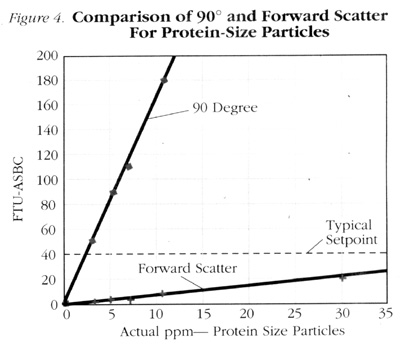
shoes results from the same test, using particles of diatomaceous earth. Figure 4 shows results on
protein-size particles. Conclusions
Per the data, the 90º measurement shows
response to each of the particle types, and can be expected to alarm at
high concentrations of any of the particle sizes.
The forward scatter shows higher gain to large particles.
Forward scatter alone shows inadequate response on protein-size
particles. For the first time, measure at two angles
allows simultaneous center-of-pipe monitoring with both the traditional
90º measurement method and the forward scatter method.
This allows direct comparison of readings on both scales, in the
pipe during filtration or product transfer. Questions? Contact McNab A91-93Legal Notice: This document may not be used, other than for reference on www.themcnab.com, under penalty of law. |
|||||||
|
|||||||