Analyses Of Yeast Data As To Its Live and Total Concentration Cell Count Using a New Optical Method Suitable for Beer Fermentation and Cropping OptimizationH. A. Teass, Jr. and Andrea ValentineMcNab, Incorporated20 North MacQuesten ParkwayMt. Vernon, New York 10550 USAPresented at the World Brewing Congress 2000, July 29 - August 2, 2000 Click here for a printable version (requires Adobe Acrobat Reader). Download time approximately 8 minutes over a 28.8 connection. AbstractThis poster addresses the use of an in-pipe optical analyzer system to measure total yeast count and live yeast count in brewery applications. This new data is presented showing the relationship between total cell count and live cell count in terms of cells per milliliter. The data supplied here illustrates the operation of a new fluorescence optical method. Introduction
The McNab HSA4 in-line total cell counter, in combination with the McNab HSF (fluorescence detector), avoids the problems sometimes found in the overworked laboratory and may replace the tedious and expensive techniques of cytometers, Coulter counters, and methylene blue staining laboratory analyses, and more importantly, improve yeast management. These optical measurements can improve the practical accuracy of brewing by introducing real time analysis. The in-line method can be coupled (via 4 - 20 mA signals) into control loops for yeast pitching, cropping and transfer. The HSA4 uses a near infrared radiation signal and is designed to be mounted in a brewery line on a common pipe - see photo Model HSF at right) or, in the case of the HSD-F, it can be mounted in the wall of the fermentation or uni-tank. In the past, there have been several in-line brewery process analyses methods for measuring yeast concentration. Early designs have used turbidity or optical density to measure loss of light, which is, of course, inversely proportional to concentration. Even where this inverse reading has been corrected, it has been found that the correlation error between simple optical density and cell count could be as high as 30% - 50%. Other designs use radio frequency and phase angles correlating to various yeast strains, where phase angle relates to live cell walls and, by extension, to total cell count. The radio frequency sensor sends electricity into the beer via wire antennas protruding into the beer. Since its introduction, concern has now been expressed as to the analyses' unwarranted sensitivity variation responding to the life cycle size changes occurring in the yeast. Further work has used an optical signal to correct for this radio frequency error. The optical instruments required for advanced work are not simple beer turbidity meters. To achieve the proper results and overcome the problems described above, the optical instrument must be free of the turbidity problems such as beer color interference, particle reflectivity, etc. Furthermore, the measurement must be linear (no change of sensitivity in the range of the analyzer) and the optics must be of superior quality. Additionally, the optics for measuring cell fluorescence must also be of extremely high quality. The fluorescence method is used here, and may be thought of as irradiation of the yeast cells with a certain wavelength of light. If they are live cells, they will carry the right type of chemistry (NADH) and will emit fluorescence at another longer wavelength (emission). The amount of energy is proportional to live cell concentration as well as metabolic activity. This signature is akin to a beer 90º haze signal in that the amount of fluorescence signal is proportional to the concentration of yeast cells.
ObjectivesThe overall objective of this research was to use the Model HSA4 as well as the fluorescence analyzer to determine the total, and live cell concentration. Earlier work has demonstrated the faithfulness of the HSA4 in correlation to ASBC total cell counting methods, including hemocytometer, spindown and Coulter counter or its variations. So this poster objective is to demonstrate the correlation between live cell concentration and the optical fluorescence signal suitable to the McNab existing beer optics. Method 1The equipment was set up in the laboratory according to the manufacturer's instructions. Yeast samples, in different proportions of both live and dead cells, were introduced into the testing apparatus. (Yeast type was McNab Yeast 1127.) The readings of total and the readings of live were scaled according to the tradition of the brewing industry (i.e., million cells/ml).
Method 2In order to avoid the practical ambiguities of methylene blue staining tests, our laboratory ratioed live and dead cells according to count in the range from 100% to 40% live cells and used that as a basis of the measurement sample. It is to be noted that, with this method, dye additives are not required in order to achieve cell fluorescence.
SummaryThe fluorescence yeast data shows (in Figure 2) that live cell count tracks linearly with laboratory live cell count. RecommendationsFurther research needs to be done into the positive correlation between fluorescence signal and yeast cell metabolic activity and how this activity reflects to cell vitality. References cited strongly suggest the NAHD fluorescence level reflects cell vitality as well as viability. Further work needs to be done to establish the algorithm to combine the information to give optimum yeast management with the newly available information. Applications
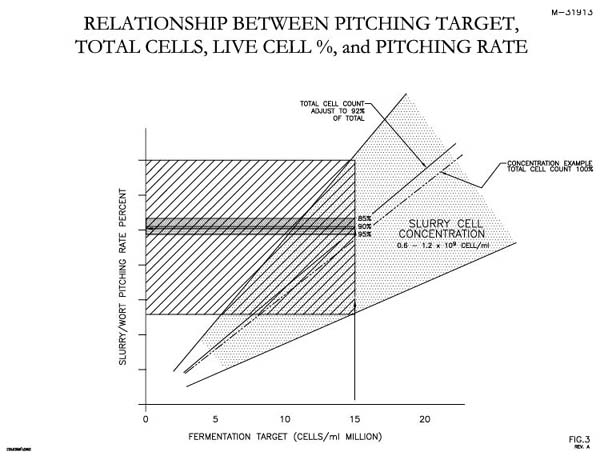
Brewery yeast slurry ranges from 600,000,000 to 1,200,000,000 cells/ml. In order to get the proper yeast ratios into the fermenter, the unwanted swing in slurry concentration needs to be accounted for. A further refinement would be to know the cells' viability and vitality. However our American surveys show that 99% of the time variation in cells' viability is less than 10%. This effect is shown in Figure 3. The optical cell counter's total, live, accurate, real-time measurement of yeast addition has these aspects, which are a benefit to the brewer.
References
A00-35 |
||||||
|
||||||
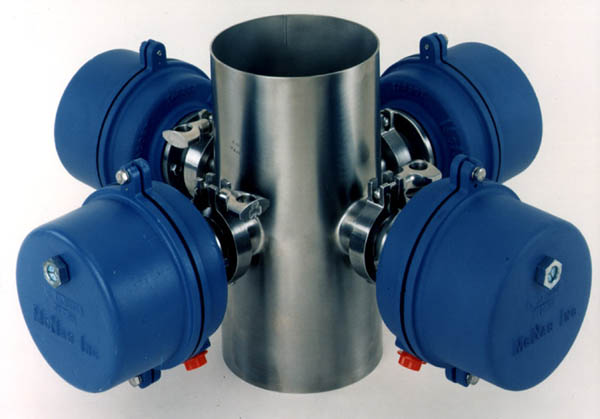
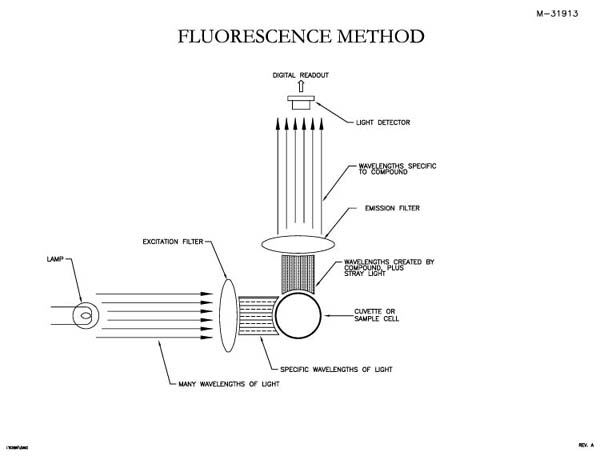
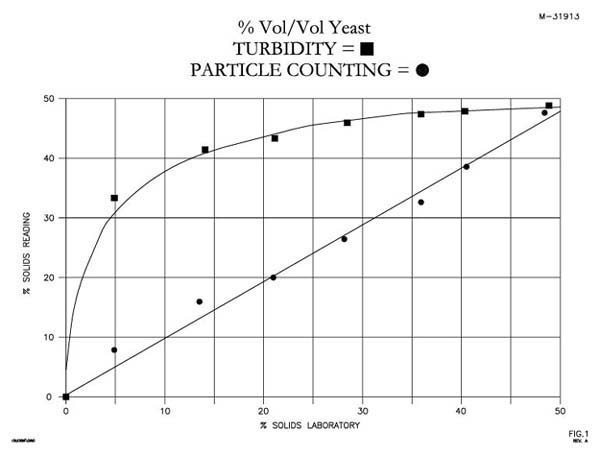 Figure 1
 Figure 2